Study to determine the safety of an intratumoral injection of tigilanol--

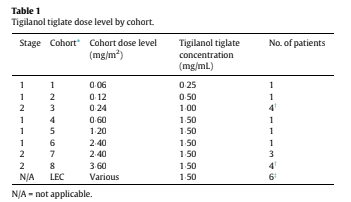
The primary objective was to establish the safety, tolerability and maximum tolerated dose (MTD) of IT tigilanol tiglate. Secondary objectives were to evaluate the preliminary efficacy of tigilanol tiglate and determine its pharmacokinetics (PK). The exploratory objective was to characterize the pharmacodynamics of tigilanol tiglate through analysis of post-administration blood and tumor tissue. Tigilanol tiglate was dissolved in 100% propylene glycol and mixed 4:6 with 30 mM sodium acetate buffer (pH 4¢2) to provide stability and solubility and was provided in 2 mL vials containing 1¢5 mg/mL or 2 mg/mL. Vials of diluent (40% propylene glycol in 30 mM acetate buffer) were supplied to allow preparation of the appropriate concentration. Patients received tigilanol tiglate via direct bolus injection(s) into no more than 3 selected superficial tumors on Day 1. The total administered volume of the solution was determined by body surface area (BSA) using the formula Volume = (BSA x Dose Level)/Concentration of Drug, where Volume is in mL, BSA is in m2, Dose Level is in mg/m2, and Concentration of Drug is in mg/mL [21]. The solution was injected into a volume of tumor estimated to be twice the volume of the injected solution (e.g., 1 mL tigilanol tiglate into 2 cm3 of tumor). Where tumors were larger than that required for the dose, a section of the tumor was injected. When multiple tumors were treated, the dose was divided in proportion to the target volume of each tumor. The dose was administered using a minimal number of injections in a fanning manner to spread the dose evenly throughout the tumor. After assessments over 24 h, patients were discharged from the study site on Day 2 and returned for follow-up on Days 3, 5, 8, 15, and 22 and, if wound healing or stabilization did not occur by Day 22, every 7 days thereafter until full healing or stabilization was achieved.
Statistical analysis
The currently supported version of SAS Software (Version 9¢4) was used to perform all data analyses. Continuous variables were summarized using the statistical mean median, standard deviation, minimum and maximum. Mean with standard deviation, and median with interquartile range, were presented to one more decimal place. Categorical variables were summarized with
frequency counts and percentages. Percentages were rounded to one decimal place, with the relevant patient population being the denominator. Only basic descriptive statistics were performed. The sample size for this study had been selected without performing a power calculation to provide descriptive information on safety, tolerability, and PK following administration of tigilanol tiglate and was done to minimize the number of patients exposed to potentially subtherapeutic levels of the drug.
Dose escalation
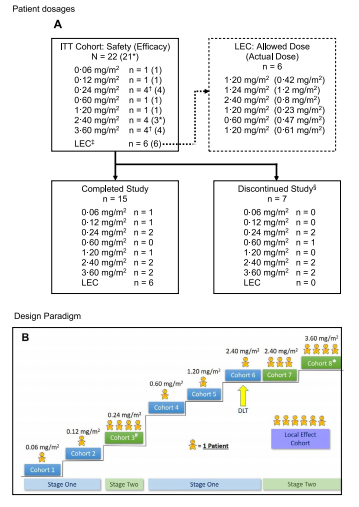
Single-patient cohorts 1 and 2 of Stage 1 received 0¢06 and 0¢12 mg/m2 of tigilanol tiglate, respectively, and no DLTs were observed (Table 1). Per protocol, transition to Stage 2 then proceeded and four patients were dosed in Cohort 3 at 0"24 mg/m2; the fourth patient was enrolled because leakage of study drug out of the tumor following IT injection occurred in one patient. Given the satisfactory tolerability of IT tigilanol tiglate in Cohort 3, the protocol was amended to allow resumption of Stage 1 (single-patient cohorts), and this was continued through three dose levels to 2¢4 mg/m2. At this dose, a DLT of airway swelling was encountered, which led to transition to a second Stage 2 and expansion of the cohort to a total of four patients (Cohorts 6 and 7). Escalation then proceeded to the 3¢6 mg/
m2 dose level, which was completed without DLT. Although MTD was not reached in the study, dose escalation in the second Stage 2 was discontinued at the Cohort 8 dose level of 3¢6 mg/m2, which was
deemed by the sponsor to have provided an appropriate balance of safety and potential efficacy.
Safety and tolerability
The vast majority of AEs (96%) were mild to moderate: 135 events were assessed as Grade 1, 81 as Grade 2, six as Grade 3 (four reports of injection site pain and single reports of abdominal pain and stridor), and two as Grade 4 (life-threatening upper airway obstruction and sepsis, respectively). There was one DLT and there were two serious AEs, 160 TEAEs, and no deaths. The DLT (upper airway obstruction) occurred in a patient who was treated with 2¢4 mg/m2. The two serious AEs were sepsis and upper airway obstruction (also the above DLT). Sepsis due to Streptococcus pyogenes, which was con-
sidered possibly related to IT tigilanol tiglate, developed 6 weeks after IT injection and subsequent tumor ulceration in an elderly male with chronic venous insufficiency and an atypical fibroxanthoma on his leg, which eventually healed without evidence of residual tumor. Upper airway obstruction, which developed after subcutaneous infra-auricular/upper neck IT injection, was considered probably related to IT tigilanol tiglate because of altered anatomy including lymphatic drainage after surgery (neck dissection) and radiotherapy (undertaken prior to recruitment to this study) and subsequent parapharyngeal edema necessitating a precautionary tracheostomy. Abdominal pain was considered “not related” to IT tigilanol tiglate. The most common AE was injection site reaction in 12 patients, representing 46% of all treatment-related AEs and 33% of all TEAEs. The observed injection site reactions were Grade 1 for eight patients, Grade 2 for ten patients, and Grade 3 for four patients, and there was an observed dose-response relationship with respect to the frequency and intensity of injection site reactions. Injection site reactions are shown in Fig. 2.